SEEK - Search-Based Exploration of Expression Compendium
What is SEEK?
SEEK is a computational gene coexpression search engine, which provides biologists with a way to navigate the massive expression compendiums in 6 organisms: human, mouse, worm, fly, zebrafish, and yeast. SEEK returns a robust ranking of genes coexpressed with the user’s query genes across hundreds of thousands of expression experiments. Additionally, it prioritizes thousands of expression datasets by the query genes’ coexpression signal in each dataset. Datasets where the query genes are more strongly coexpresesed will be prioritized, and contribute more to the ranking of coexpressed genes. The unique strengths of SEEK include its support for multi-gene query and cross-platform analysis, as well as its rich visualization features.
Cross-organism, cross platform, coexpression search
For each gene query, SEEK is automatically and simultaneously run in all six organisms. Users can explore conserved functional enrichments across organisms, and compare the coexpression patterns of the query genes across organisms.
SEEK hubbiness correction
SEEK uses a hubbiness correction algorithm to prevent retrieving generally hubby genes (i.e., well connected genes, see Barabasi et al , Han et al, Xulvi-Brunet et al) that might have high coexpression to the query regardless of the query composition. For each gene in the retrieved list (such a gene is known as the target), it subtracts the average coexpression score of the target gene calculated from the coexpression of the target to all genes in the genome. The effect of this correction is that a highly connected target gene will be brought down in the ranking due to subtracting its higher average coexpression score, so that the degree of the genes will be balanced out in the coexpression network, and the search result will reflect genes that are more specifically correlated with the query.
Evaluation
We tested this on a group of 344 GO Biological Process slim terms, retrieving co-annotated genes from each slim term. This hubbiness correction brought improvement to 219 GO terms, with the average performance improvement being 124%.
In the other 125 GO terms where performance did not significantly improve or performed worse, the correction procedure was able to retain >83% of the original performance. The performance is measured in terms of the precision at 10% recall. In another evaluation, we sought to evaluate whether SEEK successfully downweighted frequently retrieved genes.
Getting Started
Starting a search
Enter a query as gene symbols or entrez IDs, separated by spaces or commas (see the Figure below). A query can be two or more genes (up to ~150). A key assumption of SEEK is that the query genes should be, to an extent, functionally related. For example, the query should be biologically coherent and represent a common biological process, function, module, or physical interactions. In many cases, researchers query genes discovered from a differential expression analysis or a screen.
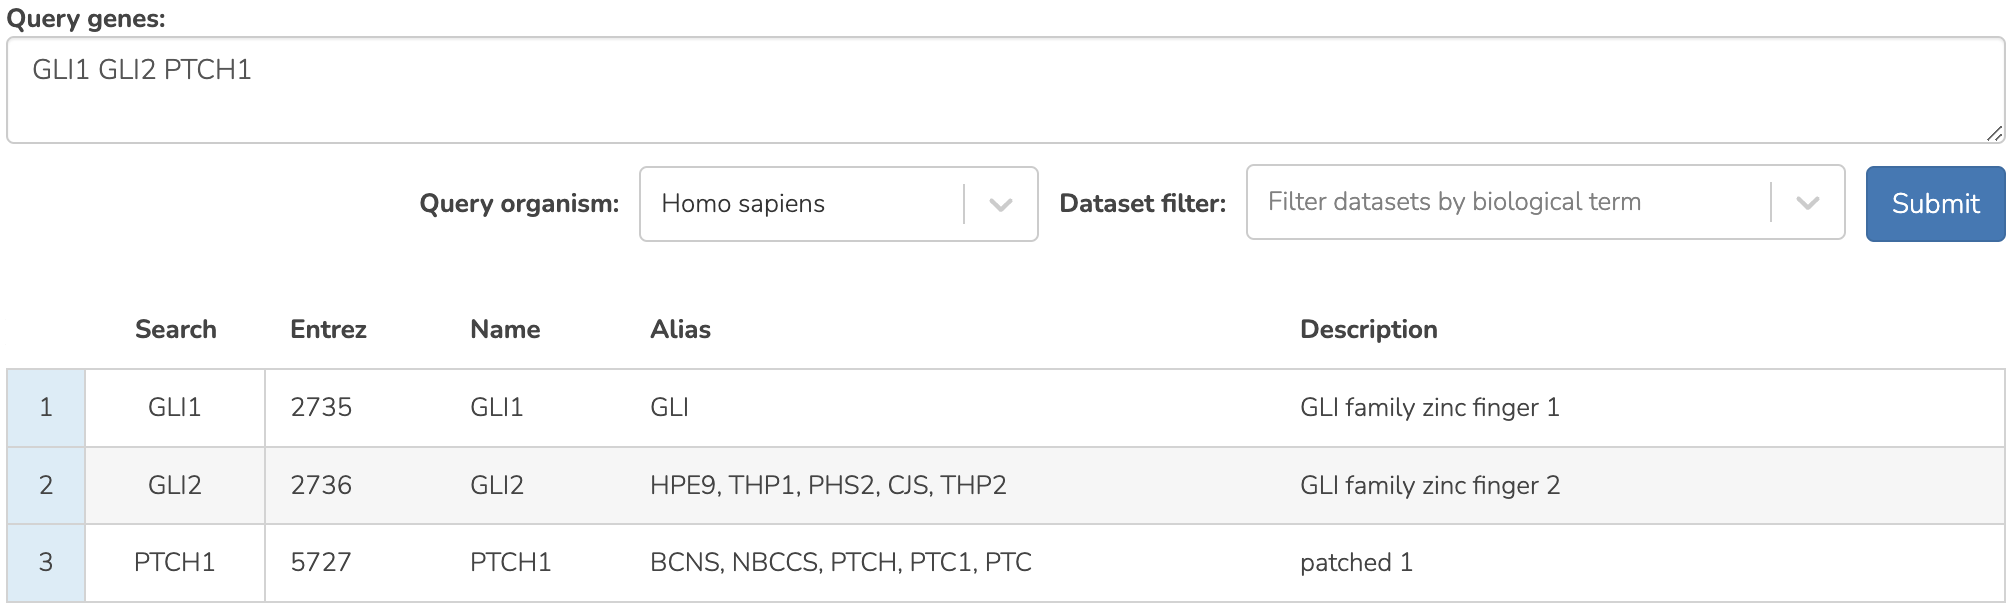
SEEK query component
Viewing the retrieved genes and datasets
Expression is the default view of the search results (shown below). The query genes and their coexpressed neighbor genes are displayed, and a side-by-side comparison across datasets is shown.
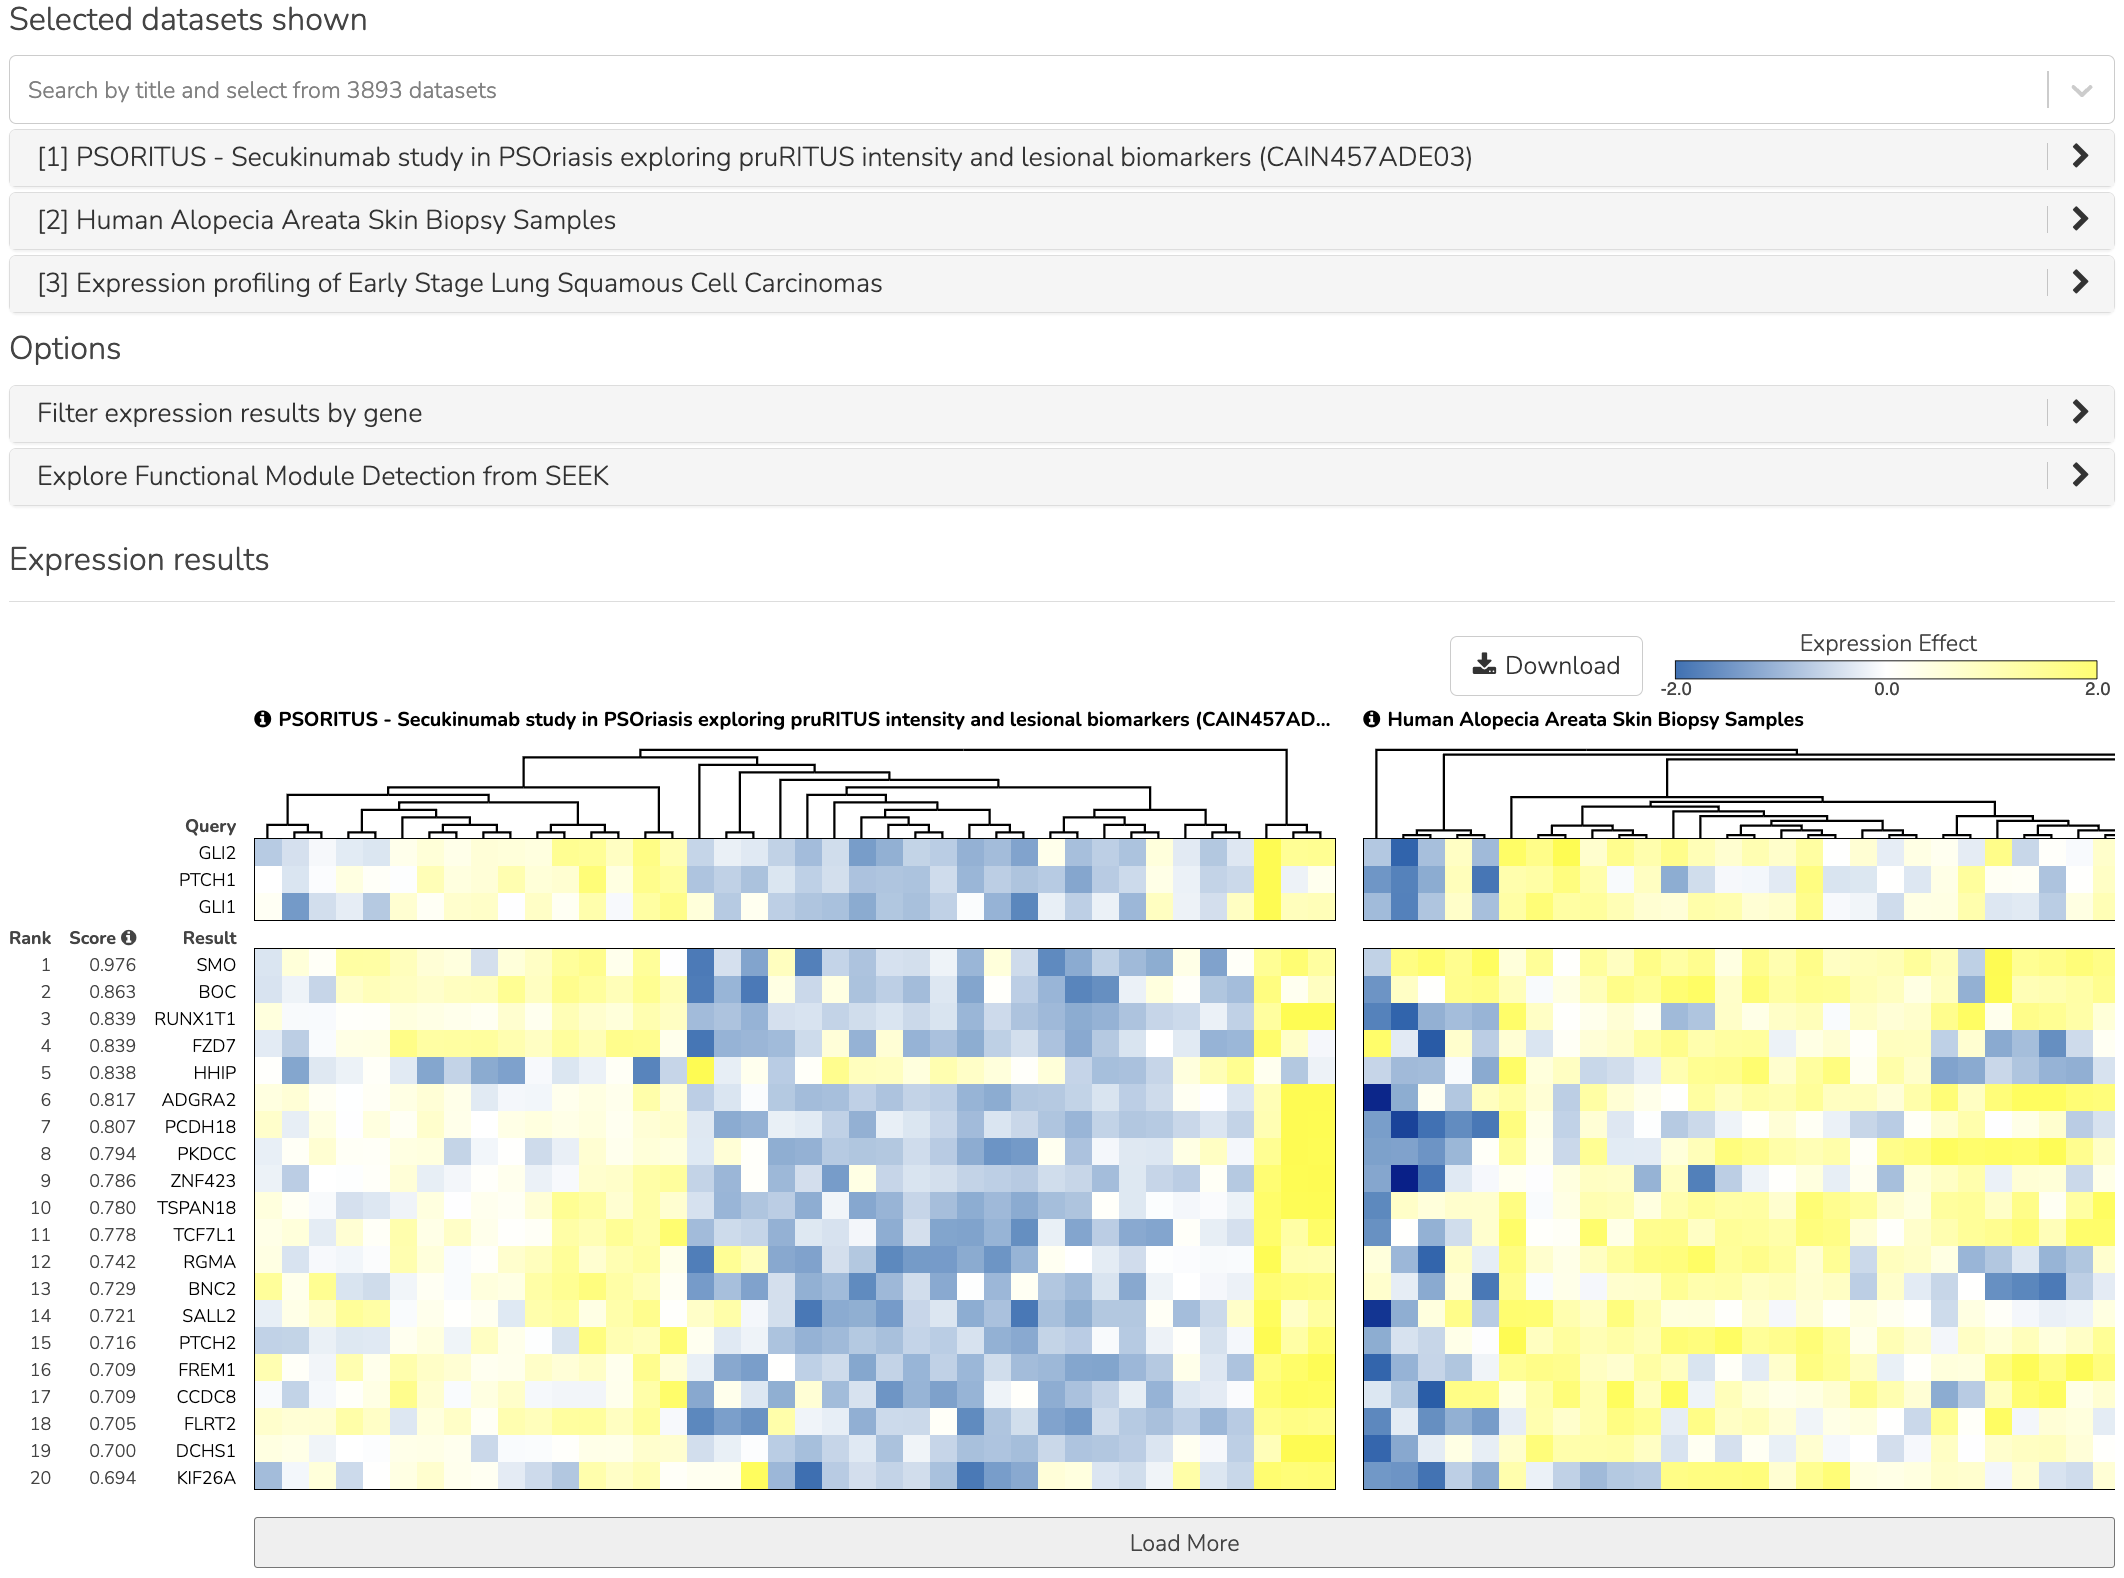
SEEK expression view
The top 3 datasets are automatically selected and ordered by relevance to the query genes. Above the heatmaps are the dataset titles. To the left of the heatmaps the row header are the gene names and coexpression score. The gene can be clicked to open up its HumanBase network anaylsis in a new browser tab. SEEK derives a single integrated coexpressed gene ranking, since it is more reliable than from a single dataset. This integration weights datasets differently, according to which query genes are used.
You may search the dataset titles and add or remove datasets to compare. The titles of the selected datasets appear in an expandable accordion component (see below), which shows the dataset details when opened.
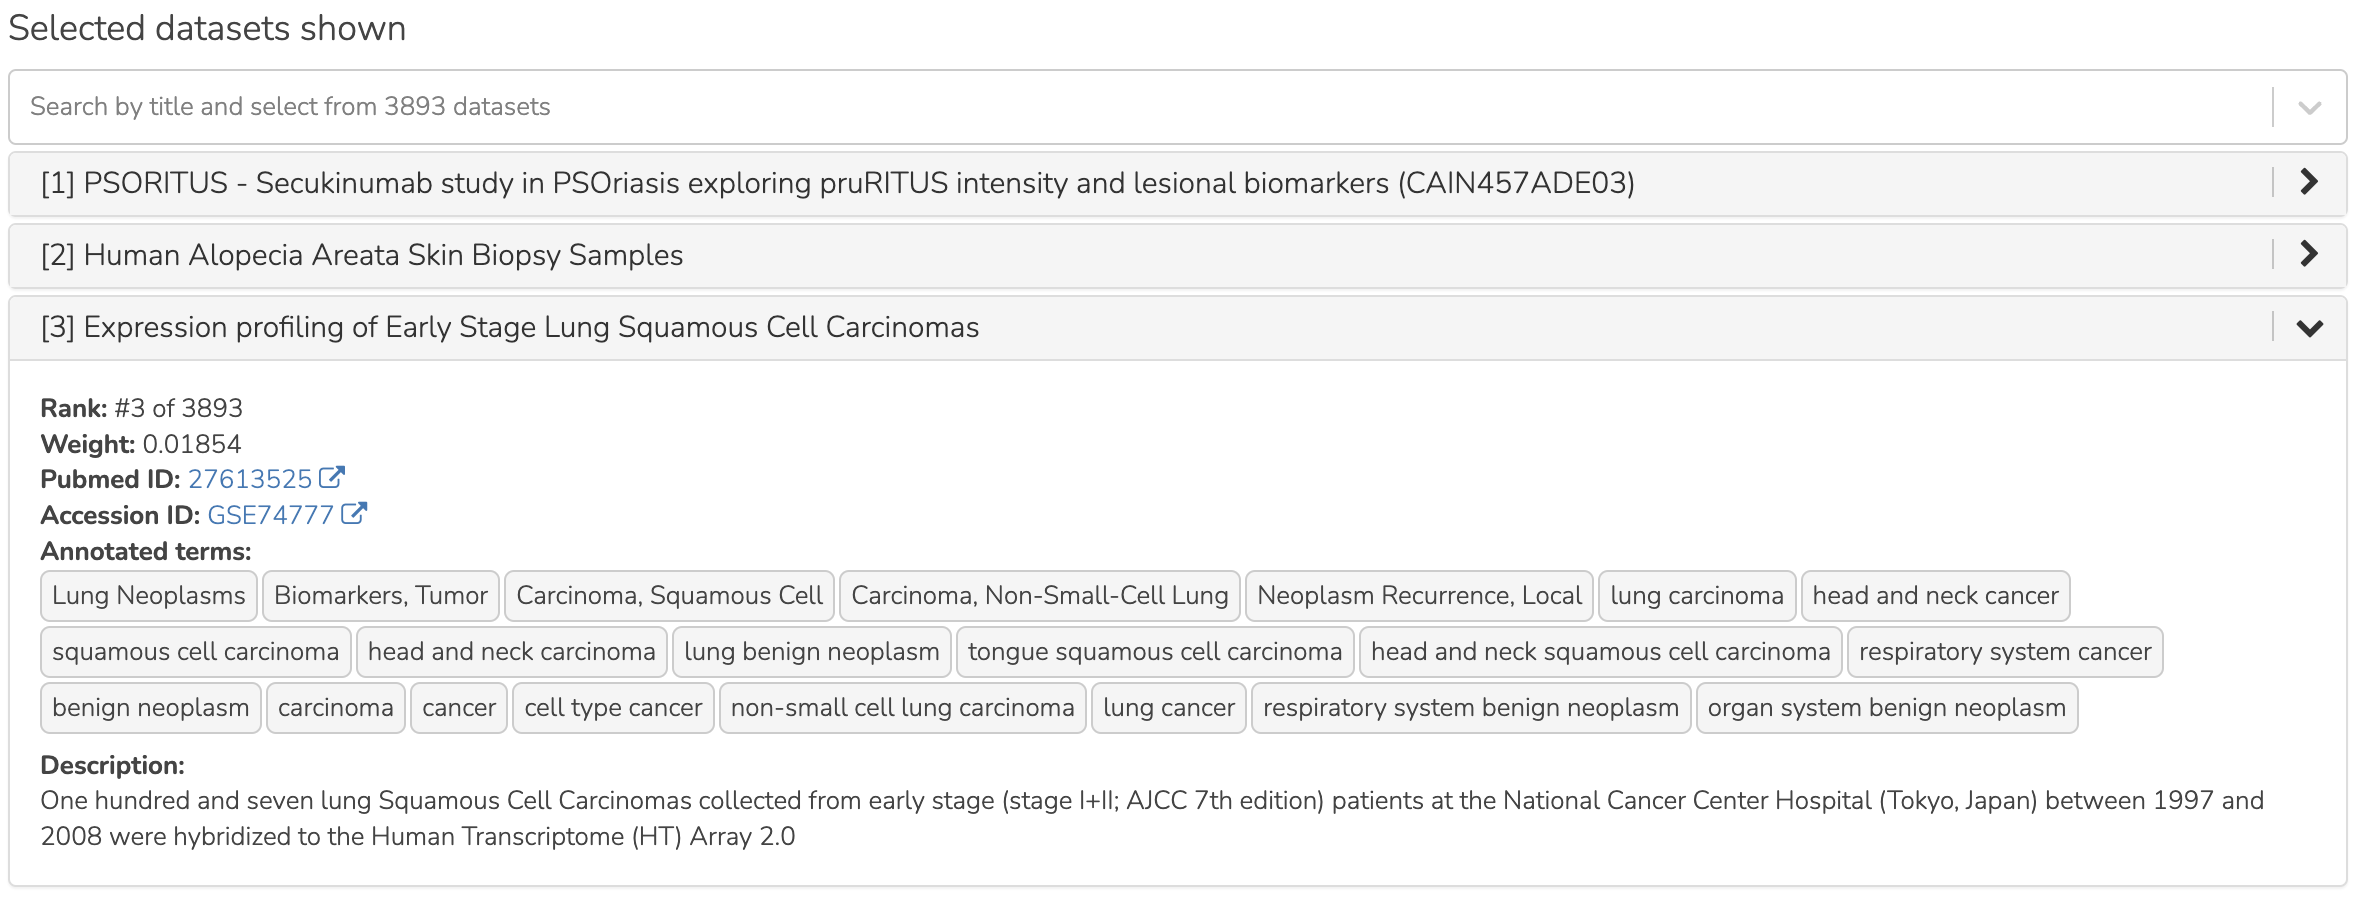
SEEK expanded dataset panel
Gene-enrichment analysis
SEEK allows users to search for a set of genes from one of six organisms: human, mouse, worm, fly, zebrafish, and yeast, to find patterns of coexpression. The SEEK system then automatically prioritizes relevant datasets, where patterns of coexpression are conserved. Since results are simultaneously calculated for each organism, we rank each for their similarity to the query organism with regards to gene function preservation. We also show term enrichment across the prioritized datasets to better understand the different experimental contexts in each model organism that are driving the observed results.
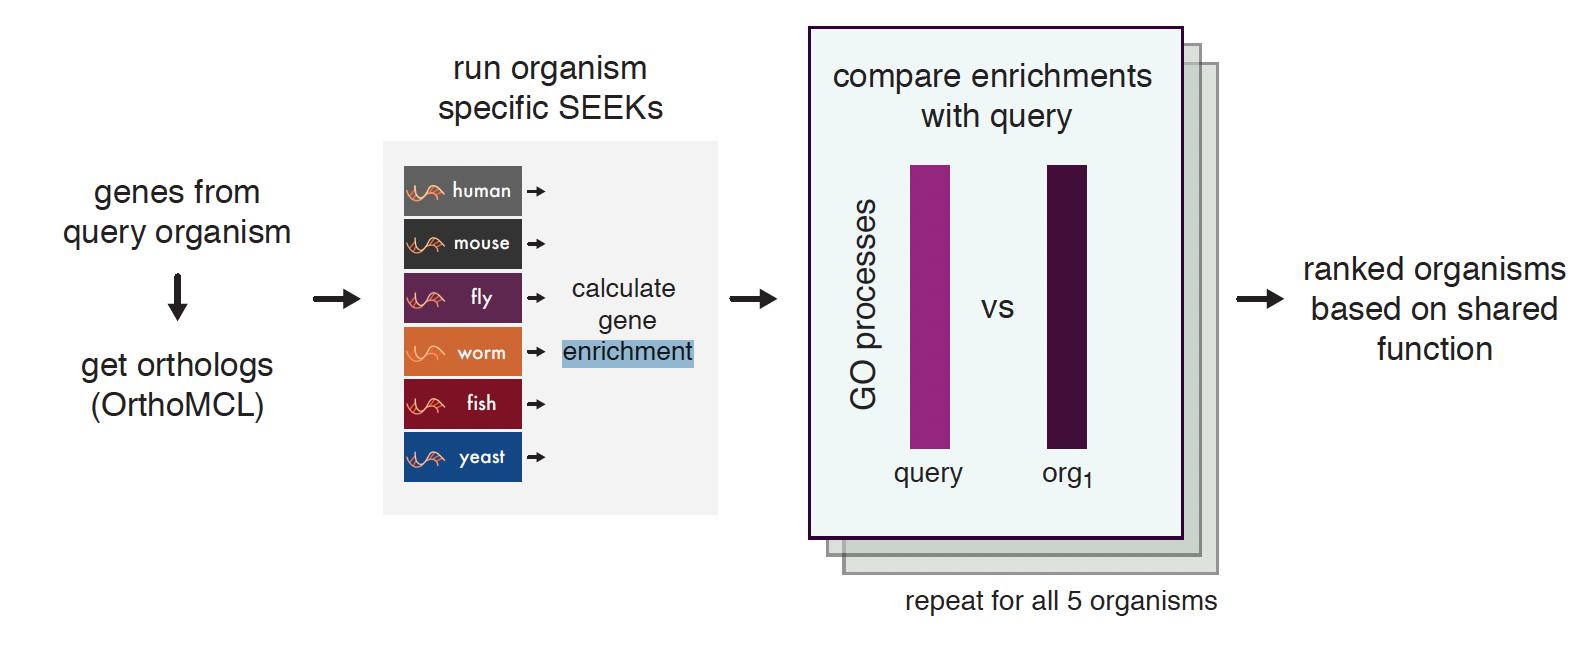
Flow chart description of SEEK enrichment
SEEK converts all genes from the initial query into their orthologs using annotations from the OrthoMCL database.
SEEK is then run for each individual organism - ranking all genes by coexpression to each query and weighting datasets where they are coexpressed. Rank-based enrichments are then calculated for the gene rankings and the datasets to give a picture of the functional similarities between organisms.
These functional enrichments for the genes are then each compared to the enrichment terms of the query organism in a pairwise manner (using Spearman correlation) that captures how many processes are shared between the query and the other organism.
Finally, these results are ranked and presented to the user along with the lists of shared GO terms derived from the gene rankings and shared terms covered by the dataset rankings (see Figure: Ortholog Ranks and Figure: Gene and dataset enrichments).
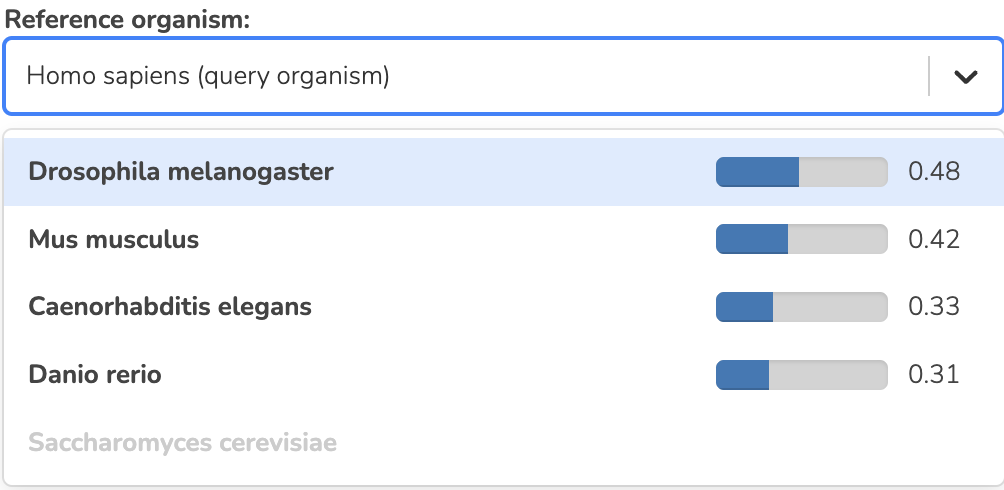
SEEK ortholog ranks
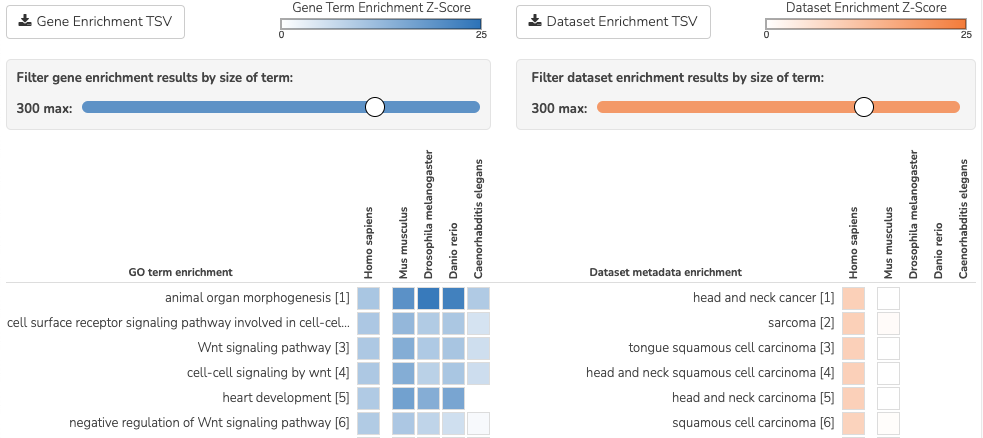
SEEK gene and dataset enrichments
SEEK provides an avenue to explore coexpression patterns within an organism, but in addition, also allows users to examine their conservation across organisms, which can facilitate knowledge transfer between species. These cross-organism comparisons are crucial, as some particular disease processes may be more evident in the coexpression patterns of one organism versus another. In our case studies, we found that some disease processes have distinct mappings in particular organisms, suggesting that distinct model systems can capture useful, unique facets of disease pathology.
Case Studies
Case Study #1: Study a pathway of interest
This example shows how SEEK can help users to achieve these three objectives:
i. Explore a pathway across the diverse compendium datasets, in this specific example we will explore the Hedgehog signaling pathway (Hh)
ii. Find disease states and cancer types in which Hh pathway genes are coexpressed (i.e. find datasets associated with the Hh pathway)
iii. Discover other gene candidates in this pathway and examine them in the Functional Module Detection (FMD) tool which you can read about in these docs.
i. Explore a pathway
Hedgehog (Hh) pathway is a major development and cancer pathway. This pathway is perturbed in cancer patients likely caused by mutations. The pathway is SHH, DHH, IHH ligand dependent and upon ligand binding it produces the transcription factors GLI1, GLI2 which then activate a wide range of downstream processes.
To start exploring this pathway, we enter GLI1 GLI2 PTCH1 as the query genes, which are transcription factors and receptor protein that are markers of this pathway, and central to the machinery.
The figure below shows the result of this query. In this figure, the prioritization of datasets is based on the coexpression of the query genes. The top 3 datasets are automatically selected and shown in an expandable accordion component, and shown as well in the 3 heatmaps arranged side by side. These prioritized datasets represent cancer studies where the expression/coexpression of the pathway genes indicate the importance of the Hh pathway activations. Expand any dataset title in the accordion to learn more about the study.
Click here to interact with this example in a new browser tab.
Hh query GLI1 GLI2 PTCH1. The top 3 datasets are automatically selected.
ii. Find disease states and cancer types
When we examine the top datasets in this example, we have simultaneously discovered Hh activations across a diverse set of disease states, such as medulloblastoma, rhabdoid tumors, lung small-cell carcinoma. Many of these have confirmed literature associations to aberrant Hh signaling [1] [2] [3] [4].
Previously, we know that Hh misregulations often result in the constitutive activation of the pathway. Here we use the coexpression of the pathway genes GLI1/2 and PTCH1 as a proxy to represent pathway activity. Coregulations of Hh genes in this case measures active pathway signaling. Retrieved datasets will show pathway expression profiles consistent with activating Hh dysfunction.
Pinpointing disease/cancer types associated with a pathway can be very useful. It can suggest a pathway-based stratification of cancer patients based on pathway profiles, which may lead to useful strategies for treating the patient by targeting the Hh pathway. By looking across thousands of datasets in SEEK, the coexpression landscape across diverse tissue/disease states can now be comprehensively examined.
iii. Discover other gene candidates in this pathway
To answer the third question, look at the row headings to the left of the heatmaps. These are the genes that are coexpressed with the query genes. These represent genes that are predicted to be associated with Hh. SEEK retrieved many currently known members of Hh machinery, such as SMO, HHIP, BOC, and PTCH2. One of the top ranked members that SEEK identified, KIF7 (rank 33, not displayed in the figure) is the homolog of Cos2 protein in Drosophila melanogaster, and was recently verified experimentally as a Hh regulator [5] [6].
Case Study #2: Study a differentially expressed gene-set, glean underlying pathways and processes
Investigators often wish to know what biological process and pathways are underlying a differentially expressed gene-set generated from an independent microarray study or RNASeq study. But for various reasons, the gene enrichment analysis sometimes msight not find any pathways, or the relevant pathways aren’t detected. This could be due to factors such as heterogeneity of the gene-set, biological noises in the data, or limited number of genes to do enrichment on, etc. SEEK can offer an alternative solution by performing a coexpression expansion on the gene-set first.
For example, we have a set of 10 genes which represent biomarkers for the ERBB2 subtype of breast cancer (obtained from [7]). After trying gene-set enrichment analysis on these 10 genes, we could not obtain any significant enriched processes.
Query the following 10 genes in SEEK:
STARD3 MED24 GRB7 CEACAM6 SMARCE1 S100P FLOT2 ERBB2 TBPL1 TLK1
You can click here to explore the results in HumanBase.
SEEK returns several independent breast cancer studies as being highly ranked among thousands of studies that are databased in the compendium. This is a reassuring sign considering that this gene set is derived from breast cancer transcriptomic experiments. Investigators can check out these datasets to learn about the experimental design, selection of patient subjects, and clinical characteristics of these patients in these related studies.
Case Study #4: Model organisms can capture different processes of cancer
One use case of SEEK is to leverage model systems to better understand human disease. In such pursuits, users might query genes that they have identified in their study, whether from a model system or clinical data.
To simulate the latter, we used SEEK to search for disease genes taken from COSMIC (the Catalogue of Somatic Mutations in Cancer). Using these we will show how mouse and fly can be used as models of pancreatic cancer.
Pancreatic cancer has one of the worst prognosis rates of any tumor type with the chance of 5 year survival at only 5%. One main contributing factor to the poor survival rate is the fact that pan-creatic cancer is often not diagnosed until it is late stage, and symptoms are non-distinct. Any clues that would enable early detection or treatment would be important breakthroughs.
We queried tier 1 human pancreatic cancer genes from COSMIC to see if we could find any interesting disease characteristics. Mouse (p=0.46) and fly (p=0.33) models are the most functionally correlated with the query. Epigenetic processes (e.g., chromatin modification, protein ubiq- uitination, and protein acetylation) are strongly enriched in both organisms, consistent with the recent studies that demonstrate the important role of epigenetic modifications in pancreatic cancer.
Both models are also enriched for datasets with ribosome descriptors (mouse p=3.3e−4 , fly p=7.1e ̄3)). The pancreas is primarily a metabolic organ, and though fly does not have an explicit pancreas, datasets related to metabolic processes are enriched in the SEEK results for fly (glucose p=4.6e ̄3, type 2 diabetes p=5.4e ̃3, superoxide dismutase p=2.6e ̄3).
Mouse datasets do not have a dominating signal and are enriched for a mix of terms relating to different disorders and environmental toxins. These disorders (e.g., intrahepatic cholestasis p=5.9e ̄3, scleroderma p=4.7e ̄2) have hallmarks of pancreatic inflammation or toxins (e.g., butadienes p=1.3e-4) which have been shown to be damaging to the pancreas. These findings demonstrate that SEEK can pick up consistent signals between organisms that reflect functional features of their human counterparts.
Evaluating your search result
Use the Gene Enrichment function to evaluate the coexpressed genes
SEEK chooses the widely used GO biological process gene-sets as gold standard for the evaluation of coexpressed genes. Using the top R number of genes, users can examine enrichments in biological processes, as well as KEGG pathways, MsigDB (GSEA) gene sets. By default, SEEK will look for enrichment within the top 100 genes. However, it is possible that such enrichment may exist beyond top 100 genes (up to 500 genes). 500 genes represent approximately 2.9% (or 17K genes) of human genome ranked by SEEK, so at this depth we may get significant coexpression. Use the gene enrichment module to adjust these settings.
Note that a lack of enrichments beyond 500 genes likely means that the retrieved coexpressed genes are highly heterogeneous, possibly resulted by a heterogeneously expressed query. In this case, refinement of user’s query is recommended.
The SEEK publication has done systematic gene retrieval evaluations for over 995 different GO biological processes.
In general, the higher the enrichment score, the better is the biolgical signal within the coexpressed genes (and so can be said about your query genes, due to the guilt-by-association principle). SEEK allows users to highlight which coexpressed genes overlapped with a given process’ gene-set annotations.
Use the dataset enrichment chart to check for over-representation
Tissue or disease categories may be over-represented among top datasets prioritized by SEEK given query. Since every dataset is associated with some tissue/disease (non-cancer, cancer) terms, by checking for dataset-set enrichment, users can notice over-representations in these categories. Note that if tissue categories were selected, this is especially useful for prioritizing between tissues based on a gene-set of interest. One potential drawback is that these dataset categories may not fully capture the full spectrum of experimental conditions, as concepts such as tissue and disease terms may be general. So if users wish to be specific, it is recommended that they read the description of each prioritized dataset to fully evaluate its relevance.
A nice feature of SEEK is that it prioritizes more than 10k datasets given query genes and based on which exhibits significant coexpression. Users can check the produced list where an interesting dataset is ranked relative to the query.
Understand coexpression relationship between query genes and dataset rankings
In order to assess coexpression relationships between query genes, clustering (or correlation) based measures are defined to individually evaluate datasets. If query genes are strongly clustered more so than random groups of genes in each dataset, this indicates that relevant biological processes are active and the dataset is relevant.
SEEK calculates coexpression P-values for all datasets in the compendium. The measure is based on rank-biased version of Pearson correlation (see publication, referred to as the “dataset weight”)
The clustering of genes offers a lot of information about the heterogeneity of query gene-set. SEEK calculates, and furthermore visualizes how query genes are coexpressed with each other in the Expression Viewer. With this viewer, we can intuitively interpret large queries (ie. 10 query genes or more) where it is impossible to know what coexpressed groups may be formed within a large query.
How do I improve the results?
If you get a weak result after evaluating with the above methods, what can you do to improve your results?
Refining the datasets - perhaps you notice that the all-dataset search mode does not work very well for your query. In this case, try refining to a tissue or disease of interest.
If you prefer a wide-reach similar to all-dataset mode but still wished to refine for instance by cancer the solution would be to refine by cancer datasets (a highly general category with over 3000 datasets). The number of datasets is listed next to each entry in the Dataset filter.
If you don’t know which tissue to refine to, because you don’t know which tissues they are expressed in, we suggest running the query without selecting any tissues. The resulting top genes tissue your query is expressed (this works for both single gene and multi-gene query).
Refining the query
Small query - (<3 genes). Small queries may sometimes not allow SEEK to accurately prioritize datasets. In this case, we suggest expanding your query with functionally related genes (such as those that physically interact with the query). This may improve the result. For human gene queries use GIANT at HumanBase (https://humanbase.io/). For non-human organisms, use STRING or IMP to get additional genes. Along this line, another popular approach is to add tissue or disease specific genes to your query.
Large query - use visualization based evaluation discussed above to filter your query to a coexpressed subset.
FAQ
General questions
What is SEEK?
SEEK stands for Search-based Exploration of Expression Compendium. It is a gene-based human coexpression search system. Given a query gene-set, the system prioritizes thousands of expression datasets (deposited in the public repository GEO) in order to find those that may be relevant to the query. Additionally, SEEK integrates datasets to identify other genes that are coexpressed with the query genes.
What is SEEK used for?
Following are some scenarios in which finding coexpressions could be useful:
When users define a query of a single-gene, SEEK can retrieve coexpressed genes to reveal insights about the function of the query gene.
Biologists might have a small set of candidate genes from genetic screens, or other genomic studies. When users input them as a query gene-set, SEEK can retrieve other genes as a part of the common biological theme underlying the query gene-set (a biological process, pathway, molecular function, common miRNA or TF regulator, etc).
The coexpressed genes may also identify possible gene-interactions involving the query.
Because SEEK prioritizes datasets, SEEK also helps to establish associations between the query gene-set and tissues, diseases, and cell-types (which are described in the dataset metadata).
You can ask questions such as:
What are the datasets in the compendium where my query genes are coexpressed?
Are these datasets with query coexpression seem to be associated with a particular disease or tissue type?
What are the advantages of SEEK?
Advantages include:
Robust and cross-platform coexpressed gene integration, which means that coexpressed genes from multiple platforms can be added together to give a robust gene ranking.
A large collection of expression datasets being used for integration (5500 datasets with 155,000 arrays, and include RNASeq datasets).
Global or area-specific coexpression search.
Attractive visualization of expression patterns with flexible attribute-based condition display and clustering.
Algorithm questions
What is the dataset weighting algorithm used by SEEK?
The weight of each dataset is calculated at the search time and uses the query genes. The rationale is to up-weight datasets where the query genes are coexpressed [1]. The more coexpressed they are in a dataset, the more relevance the dataset has, and the higher the weight will be.
A cross-validation based algorithm is being used to give robust dataset weights. This divides the query into several parts, chooses one part as a sub-query, then evaluates how well the dataset retrieves the remaining query parts.
Frequently, the query genes are only partially coexpressed even in the most informative datasets. As a result, the correlations between the non-coexpressed parts of the query can hurt the weight of dataset that is actually calculated from the coexpressed, informative part of the query. To solve this challenge, SEEK utilizes a rank-based procedure, inspired by rank-biased precision [2] from information retrieval, to give emphasis on the high correlations between genes in the query.
Since the weighting of dataset is based on the similarity of the query genes, those datasets where query genes have incoherent expression will be automatically ignored in integration (these could be low quality datasets or datasets with spurious correlations related to the query, or irrelevant datasets). Thus this algorithm achieves automatic data quality control.
How does SEEK compute significance for dataset weight?
The significance P-value is computed from a background distribution of random coexpression edges made from a random set of genes with the same size as a real query. Such a background distribution is specific to each dataset and to each query size. A random trials made up of 1000 random queries were used and a generalized pareto distribution [3] was fitted to extract parameters of the background distribution for easy computation of the P-value.
How is the score of each gene computed?
Computing the final gene score uses the dataset weights (previously discussed in this FAQ) in order to reflect the coexpressions that are located in the top relevant datasets. For each gene \(g\), the final score is:
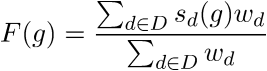
Where \(D\) is the set of datasets that contain \(g\). In the equation, the score of \(g\) in each dataset \(s_d(g)\), is given by:
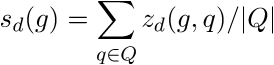
Where \(z_d\) is the correlation and \(Q\) is the query. To reduce the bias caused by those genes with insufficient dataset coverage, we discard genes that are covered by less than 50% of the compendium. These genes automatically have the lowest score.
How do I know if the coexpressed genes retrieved by SEEK are significant?
In order to assess the significance of the retrieved genes, we adopt a
null model where we assume that the query is random (i.e., a
random set of genes). We generated
10,000 random queries consisting of 100 queries per query-size, where size
ranged from 1 to 100 genes. We searched all random queries in
SEEK and produced a set of gene-rankings. Given a true query, to estimate the significance
of gene x in the true query’s ranking, we estimate the fraction of random queries where
the rank of x is higher than the rank of x in the true query. We note that the
null model is generally very similar between different query sizes beyond the query size
of 10 genes. So we can use a size-free estimation for these query sizes.
How do I know if my query is coexpressed or not?
Since the dataset weight is calculated by query coexpression, the dataset weight can directly answer this question. In general, the query would be considered coexpressed if there is a subset of datasets in the compendium with sufficiently high dataset weight.
The significance of the dataset weight can indicate how query coexpression is compared to random. The number of datasets with significant dataset weight (given some P-value threshold) can indicate whether this query coexpression is widely occurring in the compendium or restricted to a subset of datasets.
What is a dataset keyword?
A keyword is a curated term (in a controlled vocabulary) that describes a dataset. In SEEK, keywords come from the UMLS controlled vocabulary , which specifies a comprehensive set of tissue, disease types. To determine what keywords are annotated to each dataset, SEEK uses a semi-automatic strategy that involves text-mining followed by manual curation. The text-mining mines for controlled vocabulary terms within dataset description and sample description texts associated with the dataset. In manual curation, we review and correct the mappings for those commonly mismapped keywords.
Usage questions
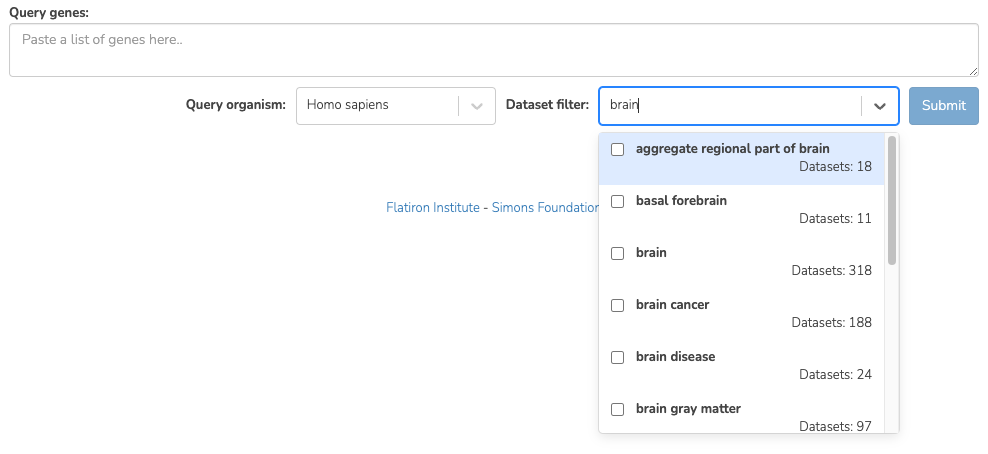
How do I narrow down the scope of datasets used in the query?
SEEK by default utilizes ALL of the thousands of datasets in the compendium for the query search. Users can however restrict to datasets with particular characteristics, such as disease-type, tissue-type, etc.
To focus your query use the Dataset filter on the Query page. For example, to restrict the query to datasets with keyword ‘Brain’, you can type ‘Brain’ in the Dataset filter box and a list of biological terms filtered by that keyword will be shown. You can then select as many terms of interest as you like. Only datasets from those terms will be considered when you submit the query.
How do I get the complete list of genes or datasets prioritized to the given query?
On the SEEK expression result page, next to the heatmap legend there is a button labeled Download. Clicking on this button will allow you to choose between downloading a CSV of either the genes ranked by coexpression score or datasets ranked by query relevance (aka weight).
How can I check the rank for a gene or dataset of interest?
There are two ways to check the rank for a gene or dataset of interest:
Get the complete list of coexpressed genes or datasets (see previous question) and search for your gene / dataset of interest in the CSV. The rank is included in the first column of each row.
(Gene only) On the SEEK expression result page, there is an option panel with the label Filter expression results by gene. You can paste a list of genes which you are interested in and HumanBase will filter the list of genes displayed in the heatmap to only those genes of interest. The rank is included on each row of the filtered heatmap.
How can I visualize the expression for a particular gene of interest?
See #2 in the previous question.
Which datasets were used for my query?
SEEK by default considers all of the thousands of datasets in the compendium for the query search (approximately 10,600). Datasets are weighted according to which query genes are used. To review the list of datasets used in a specific query, on the Co-expression results tab either:
Click on the Download -> Download datasets CSV button to download a CSV of the datasets used in the query.
In the Selected datasets shown section, instead of typing title text, click on the down arrow to the right of the search box. This will open a list of all of the datasets used in the query. You can then select any datasets of interest and they will be added to the datasets in the heatmap.
How large a query can SEEK handle?
SEEK can accept both single-gene and multi-gene queries. While queries involving several hundreds of genes are technically feasible, we do not recommend using such large queries, because they are likely to have heterogeneous expression patterns, which can contribute to a poor result. Such queries also consume large amounts of resource and take longer to complete. We therefore recommend queries with 150 genes or less.
How much time does searching a query take?
The time depends on the size of the query and the volume of traffic. If the server is not busy, the search speed is approximately 3 seconds per query gene and the time scales up linearly for larger queries. For example, searching a 3-gene query takes about 9 seconds.
Citation
Targeted exploration and analysis of large cross-platform human transcriptomic compendia Qian Zhu, Aaron K Wong, Arjun Krishnan, Miriam R Aure, Alicja Tadych, Ran Zhang, David C Corney, Casey S Greene, Lars A Bongo, Vessela N Kristensen, Moses Charikar, Kai Li & Olga G Troyanskaya Nature Methods (2015) (paper link | PMID: 25581801)